Learn How to Use Grafana to Monitor Your System
If you already have Prometheus installed on another PC that is reachable from the one you are setting up now, you do not need to deploy another instance of Prometheus, you can simply add this PC as a target in config.yaml for the existing Prometheus instance.
Introduction
I am a sucker for some good monitoring. Grafana is a pretty well known way to create a monitoring dashboard and in this guide I will cover how I do it on my Ubuntu/Debian systems.
I will be using Grafana cloud in this example. However, it should be adaptable to local installations of Grafana as well. This guide will require Docker, and I use Portainer as a GUI front end for Docker. You can follow the below guides if you need to get these set up:
We will cover the following topics:
- Set up Prometheus
- Set up Grafana
- Set up Dashboards
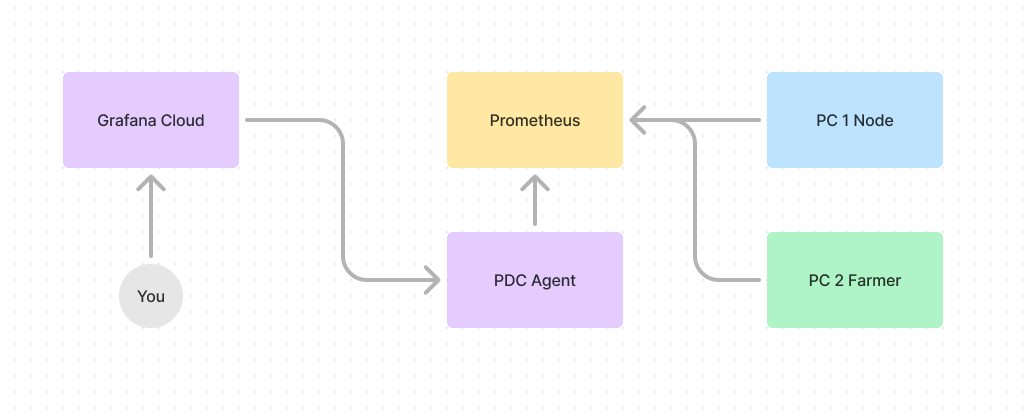
The following is an architecture diagram of what we will be setting up

Our dashboards are created on Grafana Cloud. A PDC Agent (Docker container) runs on the PC that has Prometheus running and acts as a relay between Grafana Cloud and Prometheus. Every PC you wish to monitor will publish data to Promtheues, which will then feed it through the PDC agent to Grafana Cloud.
Set up Prometheus
Prometheus is a tool for monitoring and collecting data about your systems and applications. It helps you track performance and visualize metrics using graphs and dashboards. It has an integration as a "Data Source" for Grafana, which we will be using in this guide.
We need to set up a Prometheus Docker container. If you have multiple PCs you want to monitor, you can set it up so you just have a single Prometheus instance, or you can have multiple. In this guide I will be using a single Prometheus instance. Select a host for Prometheus and create a folder to store a Prometheus config
mkdir ~/prometheus
Create Config
I prefer to store my prometheus config in my home directory. If you previously installed Prometheus via apt or another package manager it may already have a config file at /etc/prometheus/prometheus.yml. Most guides use that location as well. It really does not make a difference as far as I can tell.
Then create and open the config file
nano ~/prometheus/config.yaml
Now we need to specify a few things, and overtime we will add more to this file. To start, we want to add some global settings to scrape the metrics every 15 seconds and our first job which is for Prometheus itself:
global:
  scrape_interval: 15s

scrape_configs:
  - job_name: 'prometheus'
    static_configs:
      - targets: ['172.20.0.10:9090']
Press CTRL + x and then y to save and exit.
This configuration snippet for Prometheus sets a global scrape interval of 15 seconds, meaning Prometheus will collect metrics from configured targets every 15 seconds. The scrape_configs section defines a job named 'prometheus,' which includes a static target located at 172.20.0.10:9090, allowing Prometheus to gather metrics from that specific address. The IP address 172.20.0.10 is one I chose, and in the next step you will see how to set it up.
Create the Docker Network
I prefer to use a custom network specifically for monitoring inside Docker. You can create a new network that will allow you to use the IP shown above by running
sudo docker network create \
  --driver bridge \
  --subnet 172.20.0.0/16 \
  --gateway 172.20.0.1 \
  monitoring-network
This creates a new network called "monitoring-network" using the subnet 172.20.0.0/16 and the gateway 172.20.0.1. I prefer to keep all my monitoring on its own network.
You can choose a different subnet, gateway, and network name, but make sure to update the IP address and network name in future commands to reflect it.
Create Prometheus Container
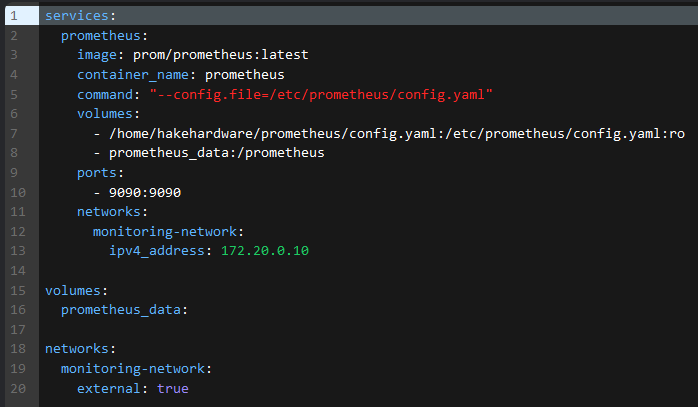
Inside Portainer, open the environment (PC) where you will be deploying Prometheus. Then create a new stack file called "prometheus". Then open up the prometheus.yaml file hosted on my github
Copy that, and paste it into the Portainer web editor. Make the following changes:
- Update
</PATH/TO/PROMETHEUS.YAML>under volumes to be the actual FULL path. You can runpwdin the folder with your prometheus.yaml file to get the full path. - Set the
<NETWORK NAME>under the BOTHnetworkstomonitoring-networkor whatever you have named your network (note there are 2 sections this needs to be done)

Now deploy the the container and check to make sure it started
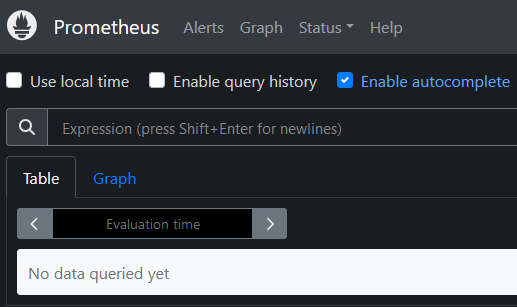
You can also confirm it is running by typing in the IP address of the PC hosting Prometheus and the port (9090) into your web browser. If you are on the PC hosting Prometheus, you should use the IP of the Docker container.

That is it for setting up Prometheus. We will come back and edit the config.yaml for Prometheus as we add more jobs.
Set up Grafana Cloud
Head over to Grafana and sign up for a cloud account. You can also use the 'self-managed' option but this guide does not cover it.
Set up a Private Data Connect (PDC Agent)
Once you are signed up, log into your Grafana Cloud account and select "Connections" on the left menu bar, and then "Private data source connect". Then select "Docker".

Make sure "Create a new token" is selected, and then generate it.
Scroll down to the pdc-agent docker image command and make note of the following:
- token
- cluster
- gcloud-hosted-grafana-id
Now open up Portainer on the environment with Prometheus and create a new stack. Call this "pdc-agent". Back on my github grab the yaml file for the pdc-agent
Paste this into your stack file and update it with the three items noted above (token, cluster, gcloud-hosted-grafana-id). Once done, deploy the container and go back to Grafana. Click "Test agent connection"
You should see a success message
Add Prometheus Data Source
Now that the PDC Agent is running, we can pull in the Prometheus data source. On the left select "Connections" again, and then select "Data sources". Click the button at the top right labeled "+ Add new data source". If you don't see "Prometheus" listed, type it into the filter input and then select it.
Enter a name
Then enter the same IP address and port you used to navigate to the Prometheus page in the browser earlier. Mine looks like
Then scroll all the way to the bottom where you see "Private data source connect". Open the dropdown and select the PDC agent. It might have a different name like something-default (1 agent connected).

Then click "Save and test". You should see a success message

Monitoring
Node Exporter is a great option for system monitoring. I have a guide on it here
cAdvisor is another good one, this is specific to monitoring your Docker containers.
For GPU monitoring you can use DCGM-Exporter