Node Exporter
Introduction
Node Exporter is a tool used for monitoring hardware and OS metrics on Linux systems. It collects a variety of performance data, such as CPU usage, memory consumption, disk I/O, and network statistics, and exposes this information in a format that Prometheus can scrape. This allows users to monitor the health and performance of their systems in real time and set up alerts based on the collected metrics.
There is a nice guide on the Prometheus site: node_exporter
This guide assumes you have Docker installed and Grafana cloud already set up with Prometheus. If you need help with that check out
This will get you up to speed. For each PC you want to monitor you will need to complete the set up process to start publishing metrics.
Download
I have made the mistake of downloading the darwin version so double check it is linux and you have the correct platform. I hate how similar arm64 and amd64 look :|
Grab the link for the latest version of node_exporter on the Prometheus download page. You likely want the one that ends in linux-amd64.tar.gz for standard Linux and linux-arm64.tar.gz for ARM boards like the COMET.
You can download the file with
wget <URL>
Then extract it with
tar xvfz <FILENAME>
Install
To install, copy the node_exporter /usr/local/bin
sudo cp <FOLDER>/node_exporter /usr/local/bin
Create a Node Exporter User
Add a new user that is specifically for Node Exporter. This user will actually run the service created in a moment
sudo useradd --no-create-home --shell /bin/false node_exporter
Change the ownership of the executable just copied to the user just created
sudo chown node_exporter:node_exporter /usr/local/bin/node_exporter
You can safely delete the file we downloaded earlier along with the folder
rm -rf <EXTRACTED FOLDER> <DOWNLOADED FILE>.tar.gz
Create node_exporter Service
A service will now be created. It’s really simple. Create a new service called ‘node_exporter’ with nano
sudo nano /etc/systemd/system/node_exporter.service
[Unit]
Description=Node Exporter
Wants=network-online.target
After=network-online.target

[Service]
User=node_exporter
Group=node_exporter
Type=simple
ExecStart=/usr/local/bin/node_exporter

[Install]
WantedBy=multi-user.target
This service will now start our node_exporter script with the user node_exporter that we created earlier
Reload the daemon
sudo systemctl daemon-reload
Then start the service
sudo systemctl start node_exporter
And lastly enable the service so it starts automatically on reboot
sudo systemctl enable node_exporter
You can check the status of the service to make sure it is running with
sudo systemctl status node_exporter
You should see it is enabled and active

Update Prometheus Config
In order for Prometheus to get metrics from node_exporter, it needs to be added to the Prometheus config. If you followed my guide on Grafana, you can edit this file by opening it up with nano
nano ~/prometheus/config.yaml
Then add a new job for node_exporter
  - job_name: 'node_exporter'
    static_configs:
      - targets: ['172.20.0.1:9100']
Take note of the IP address. This is the gateway of the monitoring network we set up in the Grafana guide. In order for node_exporter to reach Prometheus the gateway of the Docker network that Prometheus is on must be used.
If you have a different network gateway for Prometheus, you will need to change it. Once the config is updated, restart the Prometheus docker container so the changes take effect. If you are adding a node_exporter job running on another PC, you will use the IP address of the other PC as the target.
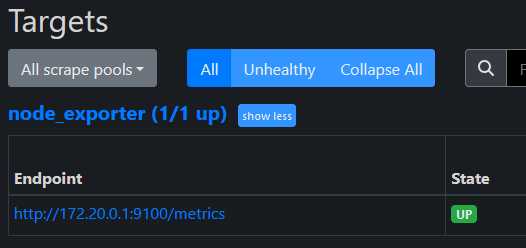
You can be sure the node_exporter target was loaded by checking the web frontend for Prometheus. Click the "Status" menu item in the navbar and then the "Targets" menu item to see all connected targets

Importing the Dashboard
There is a default dashboard that you can import to get started. Open up Grafana, got to "Dasbboards" and then click the button "New", from the dropdown select "Import". Then enter 1860 where it says "URL or ID". Then click "Load"
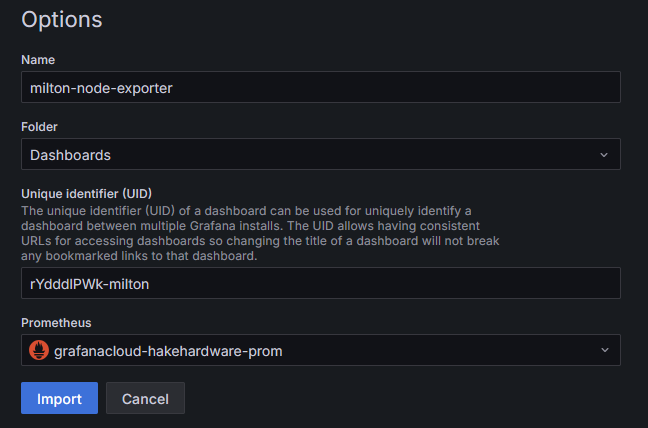
I usually make the name a bit more descriptive and change the UID slightly as well. Then select the Prometheus data source you set up. Finally click "Import"

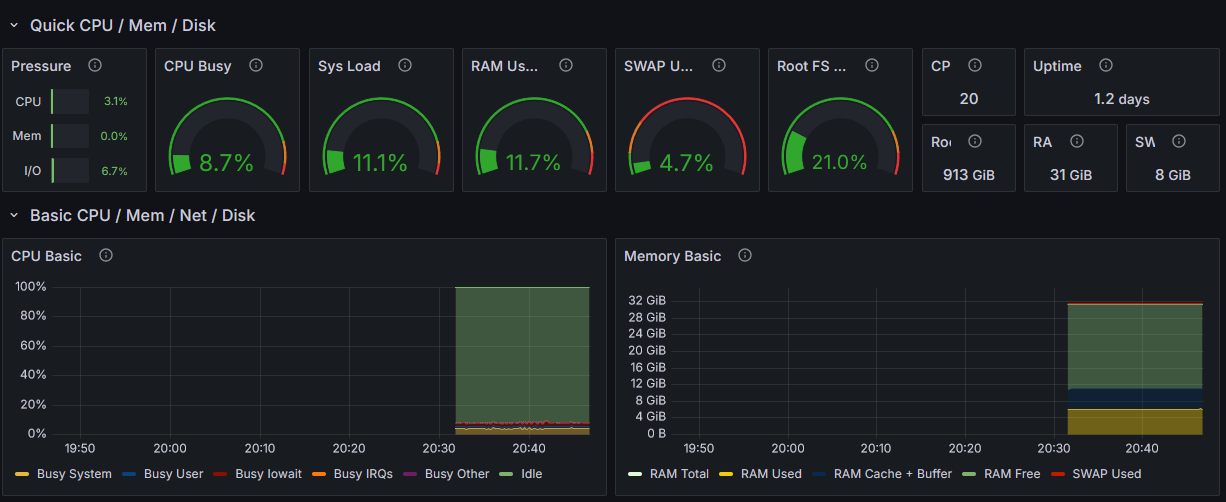
You should see the dashboard load with the default layout.

And that's it! You can now monitor your PC easily from anywhere. You can even add alerts and other cool things, but that is outside the scope of this guide.