Grafana - Monitor NVIDIA GPU
Introduction
In this guide we will enable monitoring of NVIDIA GPUs with Grafana. We will be using dcgm-exporter which is an offician NVIDIA repo. We will be running dcgm-exporter in Docker, adding the job to Prometheus, and finally importing a dashboard. I use Portainer to manage my Docker containers, and Termius to manage my SSH sessions.
You should have completed the following:
- Install Docker
- Set up Portainer
- Install NVIDIA Drivers
- Set up NVIDIA GPU for Docker
- Set up Prometheus & Grafana
These are all pretty quick to get through, and will set you up for the next step.
Deploy dcgm-exporter
The first thing that needs to be done is setting up the stack file. In Docker terms, a stack file is just a docker-compose. In Portainer, create a new stack file and name it dcgm-exporter. Then paste in the following code
services:
  dcgm-exporter:
    image: nvidia/dcgm-exporter:latest
    container_name: dcgm-exporter
    restart: unless-stopped
    runtime: nvidia
    environment:
      - NVIDIA_VISIBLE_DEVICES=all
    cap_add:
      - SYS_ADMIN
      - DAC_READ_SEARCH
    privileged: true
    ports:
      - "9400:9400"
    networks:
      monitoring-network:
        ipv4_address: 172.20.0.12

networks:
  monitoring-network:
    external: true
A few things to talk about:
- Port 9400 is used, change this if it is already used
- I use my monitoring-network that I set up in Set up Prometheus & Grafana
Deploy the stack. You may see something like
time="2024-10-11T14:57:12Z" level=info msg="Not collecting DCP metrics: Error getting supported metrics: This request is serviced by a module of DCGM that is not currently loaded"
It does not necessarily mean anything is wrong. It simply means a module was not loaded, and it may be due to the GPU you are using.
Add to Prometheus config
Now that the Docker container is deployed, the dcgm-exporter job needs to be added to Prometheus. My Prometheus config is located at ~/prometheus/config.yaml which is specified in guide linked above.
nano ~/prometheus/config.yaml
Add a section for the new job, mine looks like
  - job_name: 'dcgm-exporter'
    static_configs:
      - targets: ['172.20.0.1:9400']
        labels:
          instance: 'milton'
- A new job called
dcgm-exporteris added - The gateway of the
monitoring-networkis added, NOT the IP of the container - A label that denotes the name I have given to my PC is added, and can be exposed in Grafana
Save your file with ctrl + x and then y and finally ENTER. Restart your Prometheus docker container for the changes to reflect.
Import a Dashboard
A few people have been been kind enough to create a dashboard for dcgm-exporter. To try them out open up Grafana, go to "Dashboards" select "New" and then "Import".
Grafana Dashboard - ID 12239
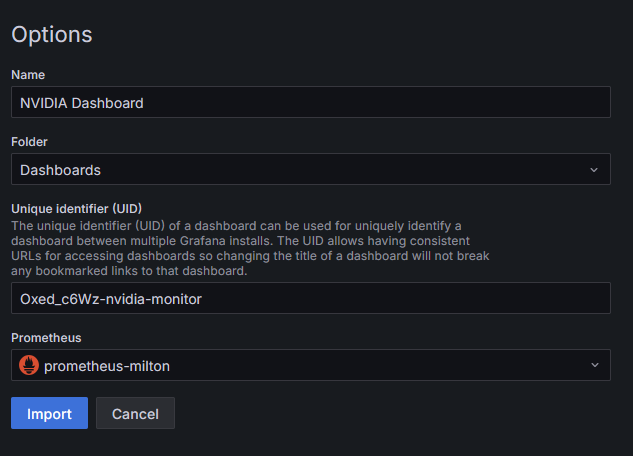
In the input box for the dashboard URL or ID, enter one the above ID and click "Load". Give your dashboard a name, update the UID to be something a bit more specific, and select your Prometheus data source.

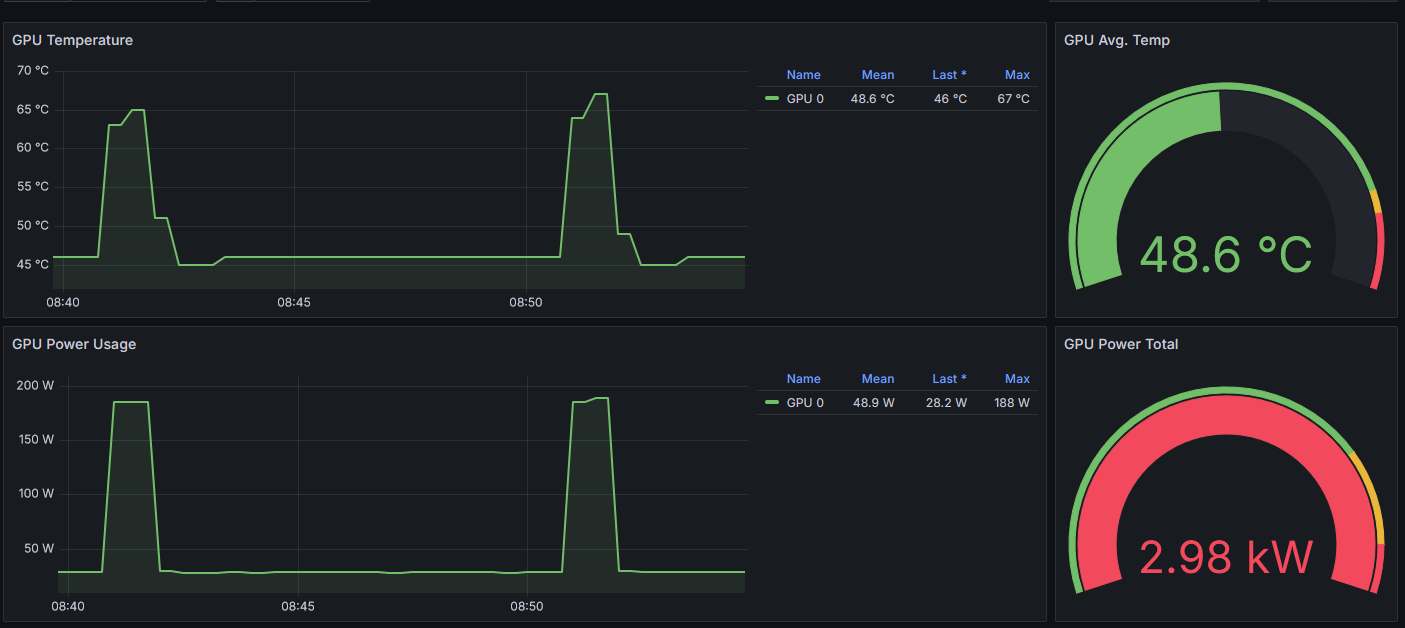
Then click "Import". You should see something like this

I like to resize things and reconfigure a few of the dashboards, but this is a great start. The things I usually care about most are Power, Temps, and Usage and that is easily monitored with this dashboard!